


A Venn diagram is a classic visual tool that uses overlapping circles to illustrate the relationships between different sets of items. The areas where the circles overlap represent the commonalities between the sets, while the separate areas show their unique traits. Named after the English logician John Venn, these diagrams are universally used in fields from education and business to mathematics and logic for comparing concepts, solving problems, and communicating complex information in a simple, intuitive way.
While you can struggle with basic shape tools in standard software, creating a professional and customized Venn diagram doesn't have to be a time-consuming chore. With the right tool, you can go from a blank page to a finished, presentation-ready diagram in just minutes. This guide will show you how to do exactly that with EdrawMax.
In this article
- The history of Venn diagrams
- Why Use a Venn Diagram?
- Venn Diagram Examples and Templates
- The Challenge: Creating Venn Diagrams the Hard Way
- The Solution: Create with EdrawMax, the All-in-One Diagramming Tool
- How to Make a Venn Diagram in EdrawMax: A Step-by-Step Guide
- Beyond the Basics: Venn Diagram Examples & Use Cases
- FAQ
The history of Venn diagrams
The origins of overlapping circular diagrams can be traced as far back as the 13th century. However, the diagram as we know it today was formally introduced and systematized by the English logician and philosopher John Venn in 1880. While commonly named after him, these illustrations are also referred to as set diagrams, logical diagrams, or primary diagrams.
Venn built upon the work of 18th-century Swiss mathematician Leonhard Euler, who utilized circles to represent logical relationships—though unlike Venn’s, Euler’s circles did not always overlap. This earlier model became known as Euler diagrams, and Venn himself initially referred to his own innovation as “Eulerian circles.” It wasn’t until several decades later that the term “Venn diagram” was widely adopted.
Venn developed these diagrams to support his work in set theory, a branch of mathematical logic that deals with collections of objects—whether numbers, concepts, or physical items—and their interrelationships. His elegant and intuitive method of visualization provided a powerful tool for representing logical connections and operations within sets.
Why Use a Venn Diagram?
Before we dive into the "how," let's quickly recap the "why." Venn diagrams are invaluable because they:
- Simplify Complexity: Turn complex data and relationships into an easy-to-understand visual.
- Enhance Comparison: Clearly highlight what is unique to each set and what they share in common.
- Boost Problem-Solving: Aid in identifying logical connections, making them essential for decision-making.
- Improve Communication: Offer a universal language for presenting findings in reports, presentations, and classrooms.
Venn Diagram Examples and Templates
To truly grasp the power of Venn diagrams, it's best to see them in action. EdrawMax provides a vast template community for various fields, allowing you to find the perfect starting point for your project. Here are a few common venn diagram examples:
1.Venn Diagram in Mathematics and Statistics
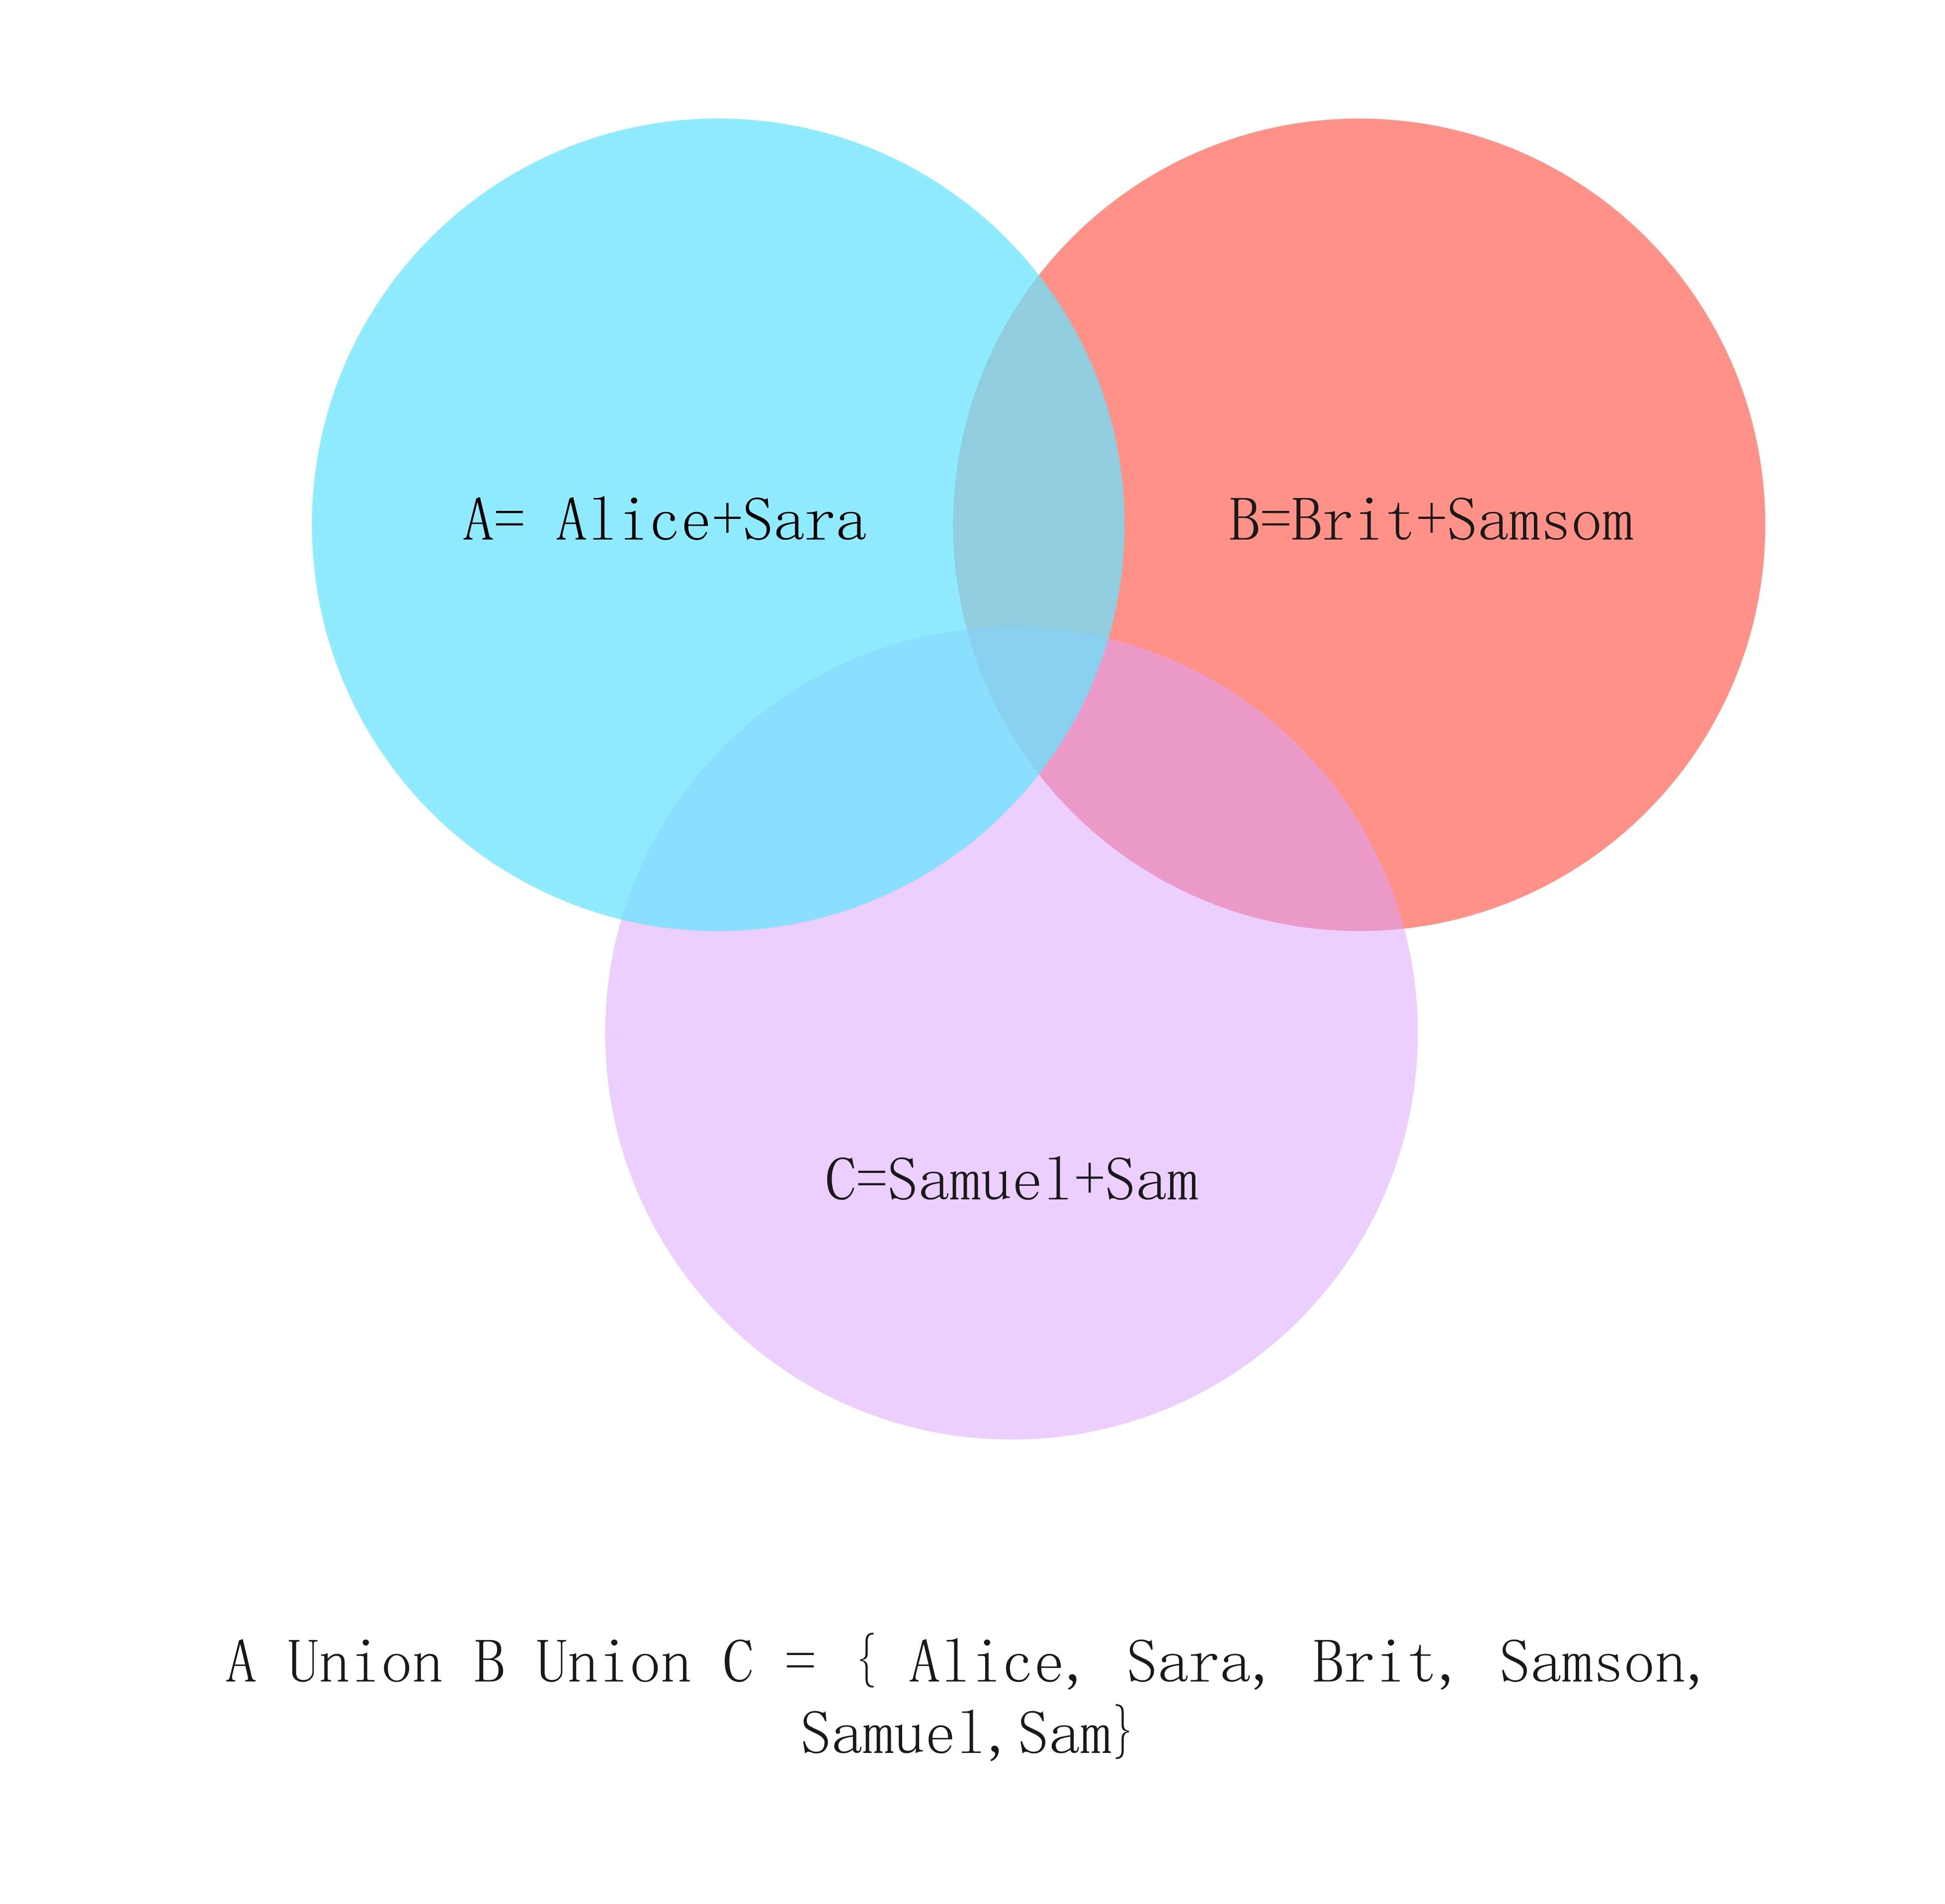
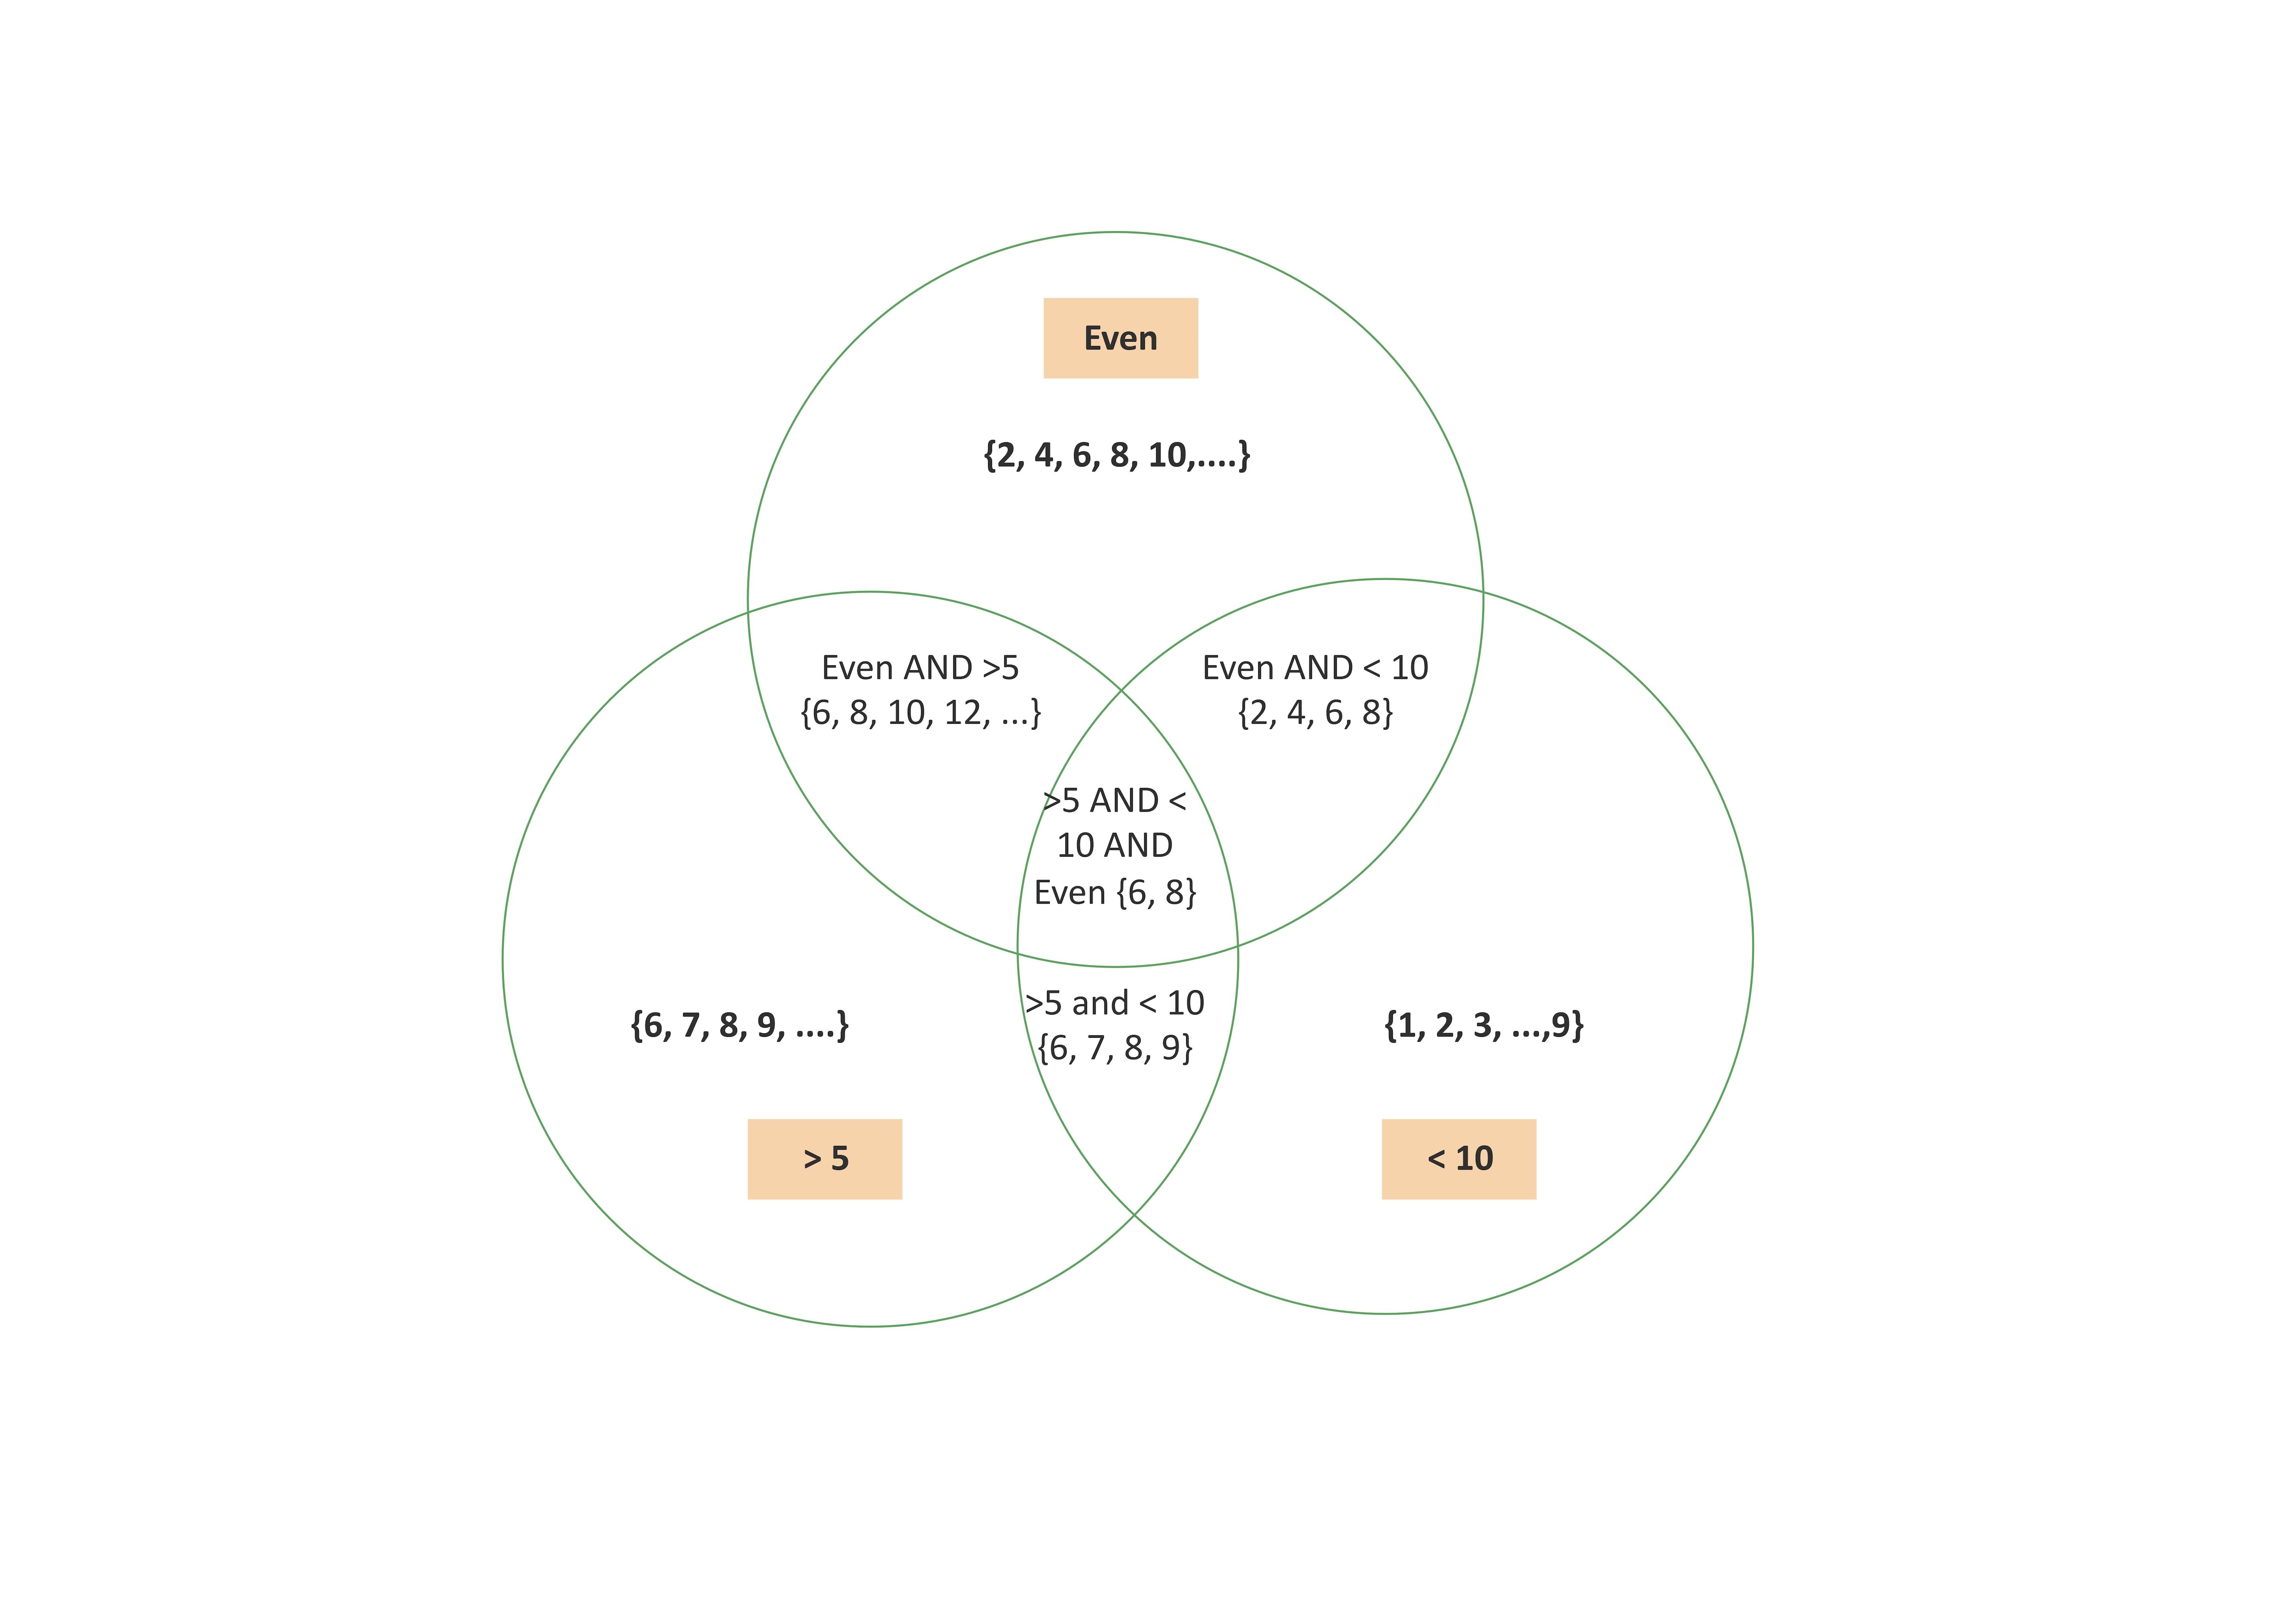
Venn diagrams are foundational in mathematics for illustrating the logical relationships between sets of numbers or elements. For instance, a diagram can vividly display the intersection between the set of even numbers, prime numbers, and multiples of three, providing an intuitive grasp of advanced concepts like unions, intersections, and complements. In statistics, they become indispensable for visualizing probability, clearly depicting relationships between events and ideas such as joint probability, conditional probability, and independence, which greatly aids in data interpretation and research.
Explore and customize a pre-made template for your math or stats project.
2.Venn Diagram in Marketing Analysis
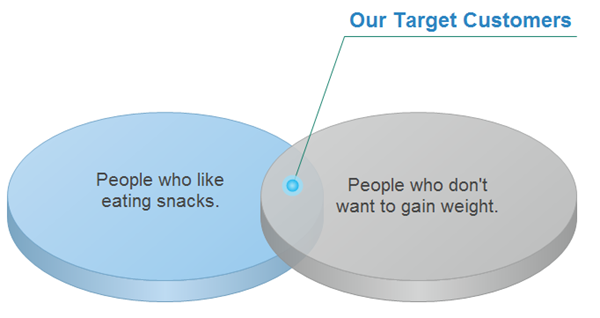
Marketing professionals rely on Venn diagrams to analyze market segments, identify core target audiences, and compare competing product features. A company might use one to visualize the overlapping preferences of different customer demographics, pinpointing shared interests and unique characteristics. This clarity is crucial for tailoring effective marketing strategies to specific segments and uncovering valuable opportunities for new product development, thereby turning raw data into actionable strategic insights.
Jumpstart your market analysis with a professionally designed template.
3.Venn Diagram in Education
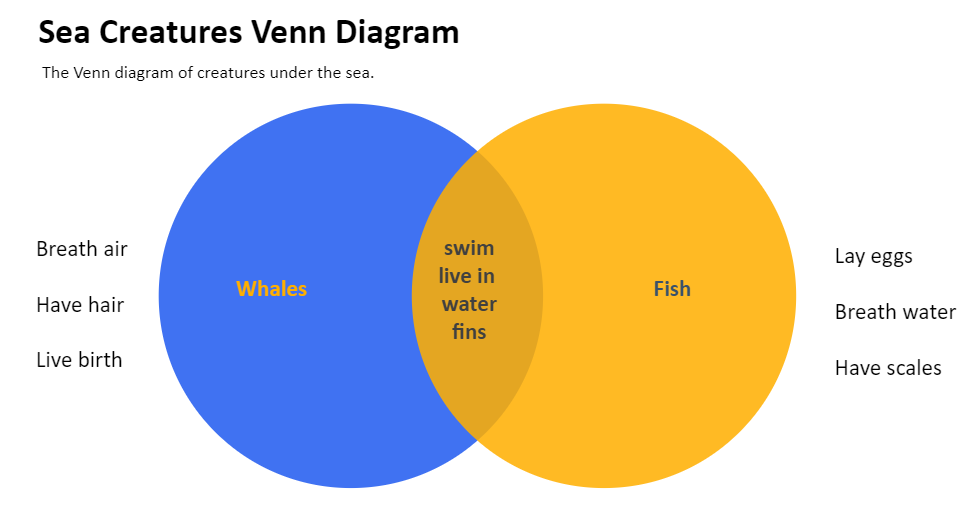
Educators frequently use Venn diagrams as a versatile teaching tool across subjects to help students compare and contrast concepts. In a literature class, students might use one to analyze the similarities and differences between two main characters or themes in novels. In a science class, it could illustrate the shared and unique traits of two animal species or chemical processes. This method transforms abstract ideas into interactive, visual learning experiences, significantly improving student engagement and information retention.
Find the perfect educational template for your classroom.
The Challenge: Creating Venn Diagrams the Hard Way
Many people attempt to build Venn diagrams directly in tools like PowerPoint or Google Slides. While these platforms are great for presentations, they aren’t designed for complex diagrams. As a result, users often spend unnecessary time manually drawing and aligning circles, adjusting transparency settings to overlap correctly, and painstakingly formatting text so it fits within each section. The process quickly becomes frustrating, error-prone, and time-consuming—turning what should be a simple visualization into a tedious design task.
Creating Venn diagrams in PowerPoint or Google Slides is tedious—endless circle alignment, color tweaks, and messy text placement. Why waste hours when you can design a polished diagram in minutes with the right tool?
The Solution: Create with EdrawMax, the All-in-One Diagramming Tool
EdrawMax is a powerful yet intuitive diagramming suite designed for professionals and students alike. It transforms the diagram creation process from a tedious task into a quick and enjoyable experience. Here’s why EdrawMax is the perfect tool for making Venn diagrams:
- Ease of Use: Its drag-and-drop interface and intelligent formatting tools make placement and alignment effortless.
- Professional Results: Access to a vast library of stylish templates and customization options ensures your diagram looks polished.
- Speed: Pre-made templates and smart features help you create venn diagrams in minutes, not hours.
- Versatility: Beyond Venn diagrams, EdrawMax supports mind maps, org charts, floor plans, and hundreds of other diagram types.
Ready to create? Follow these simple steps.
How to Make a Venn Diagram in EdrawMax: A Step-by-Step Guide
Even though you can use other methods to make a Venn diagram, such as a pencil and a paper, EdrawMax online gives you an easy and modernized way. To create your diagram using EdrawMax, follow the steps below:
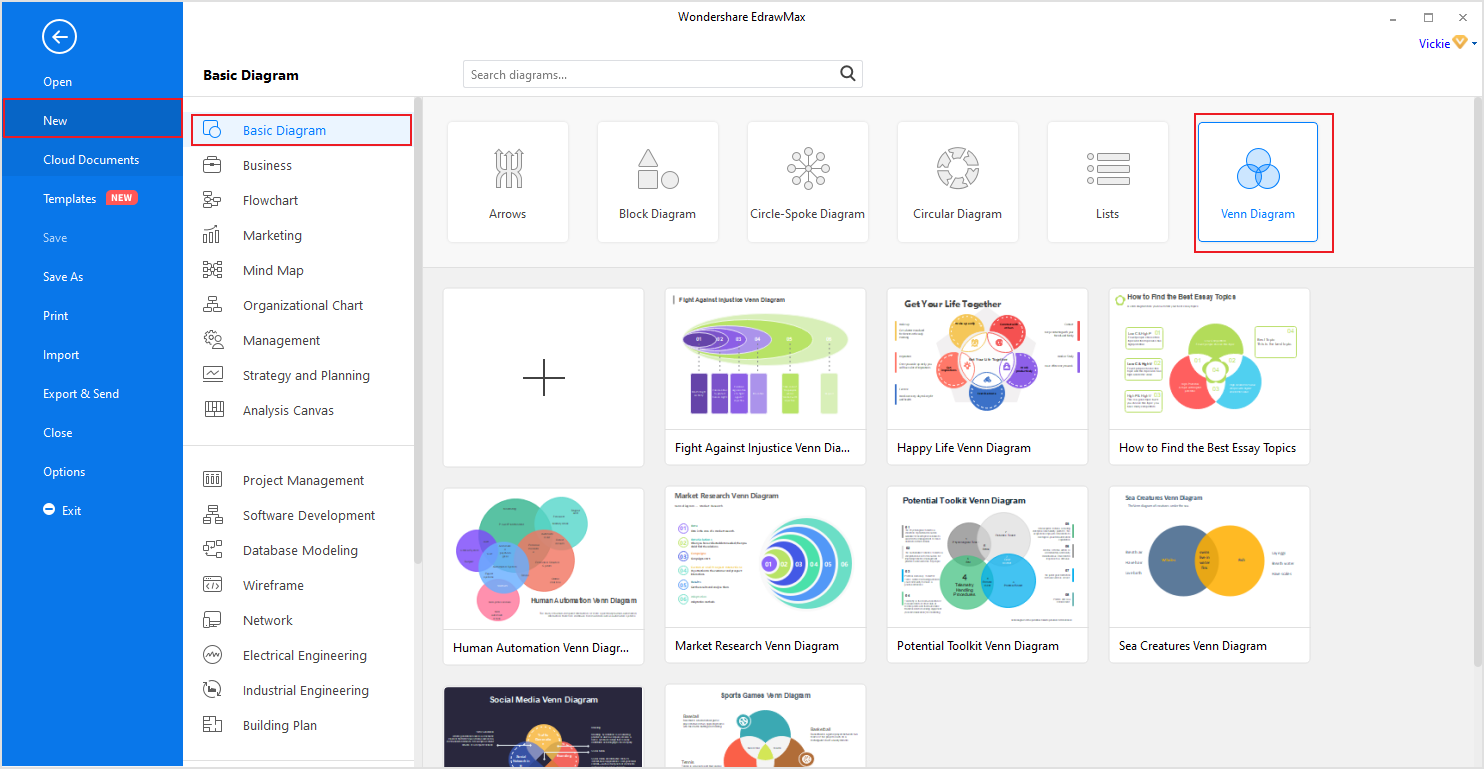
Step 1: Select Basic Diagram
Click [New] on the left side blue navigation pane and then [Basic Diagram] on the adjustment pane to open the Basic Diagram designing page. After it's done loading, click on [Venn Diagrams] located at the upper right section of this window.


Step 2: Make or Modify your diagram.
At this point, there are two option you can go with
1) Click [+] to create a new diagram from scratch or
2) Select any Venn diagram templates you prefer from the ones posted there and then modify them to meet your requirements.
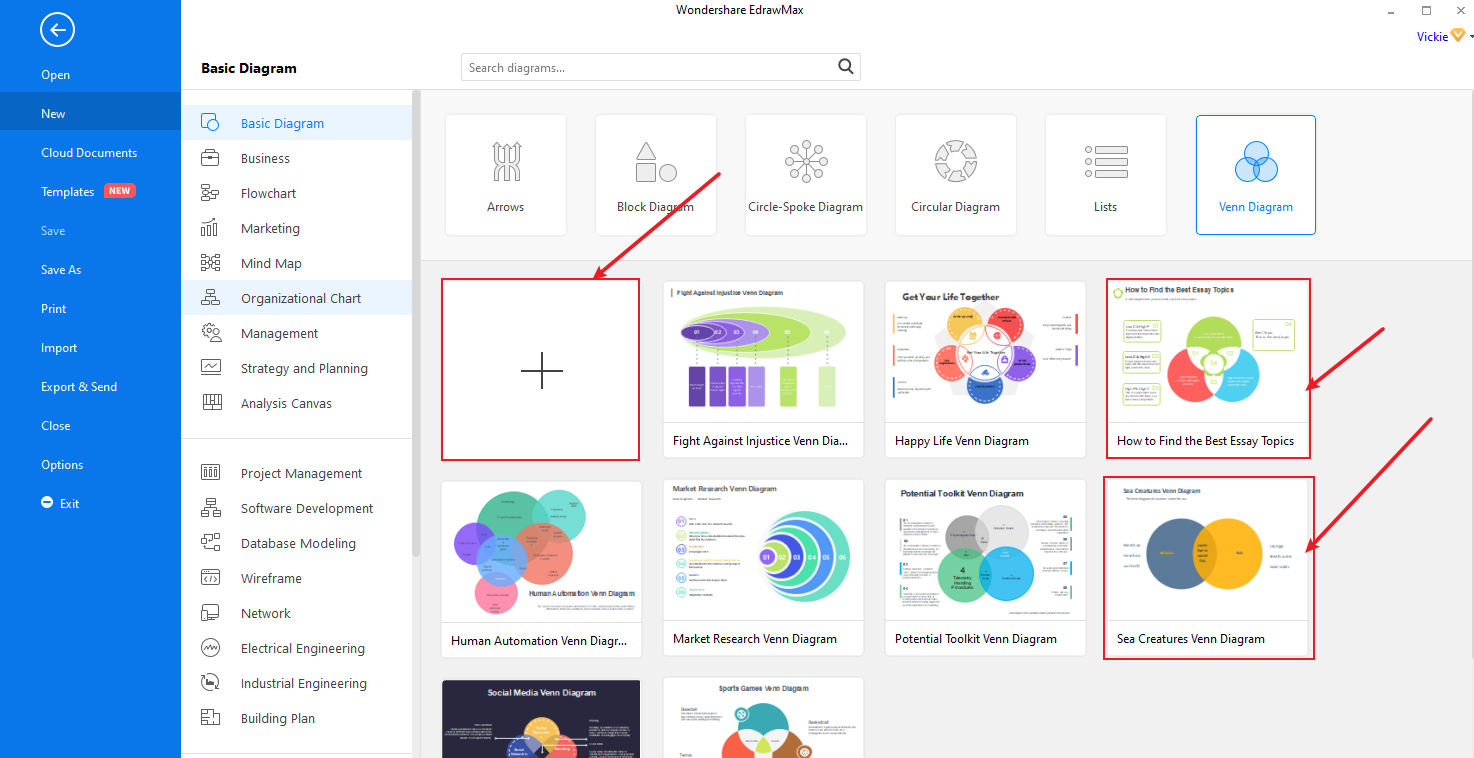
Irrespective of what you choose, you will or may end up needing to add extra symbols and characters to your diagram. And to do so, you can choose all relevant symbols from “Symbols library” or Venn chart library.
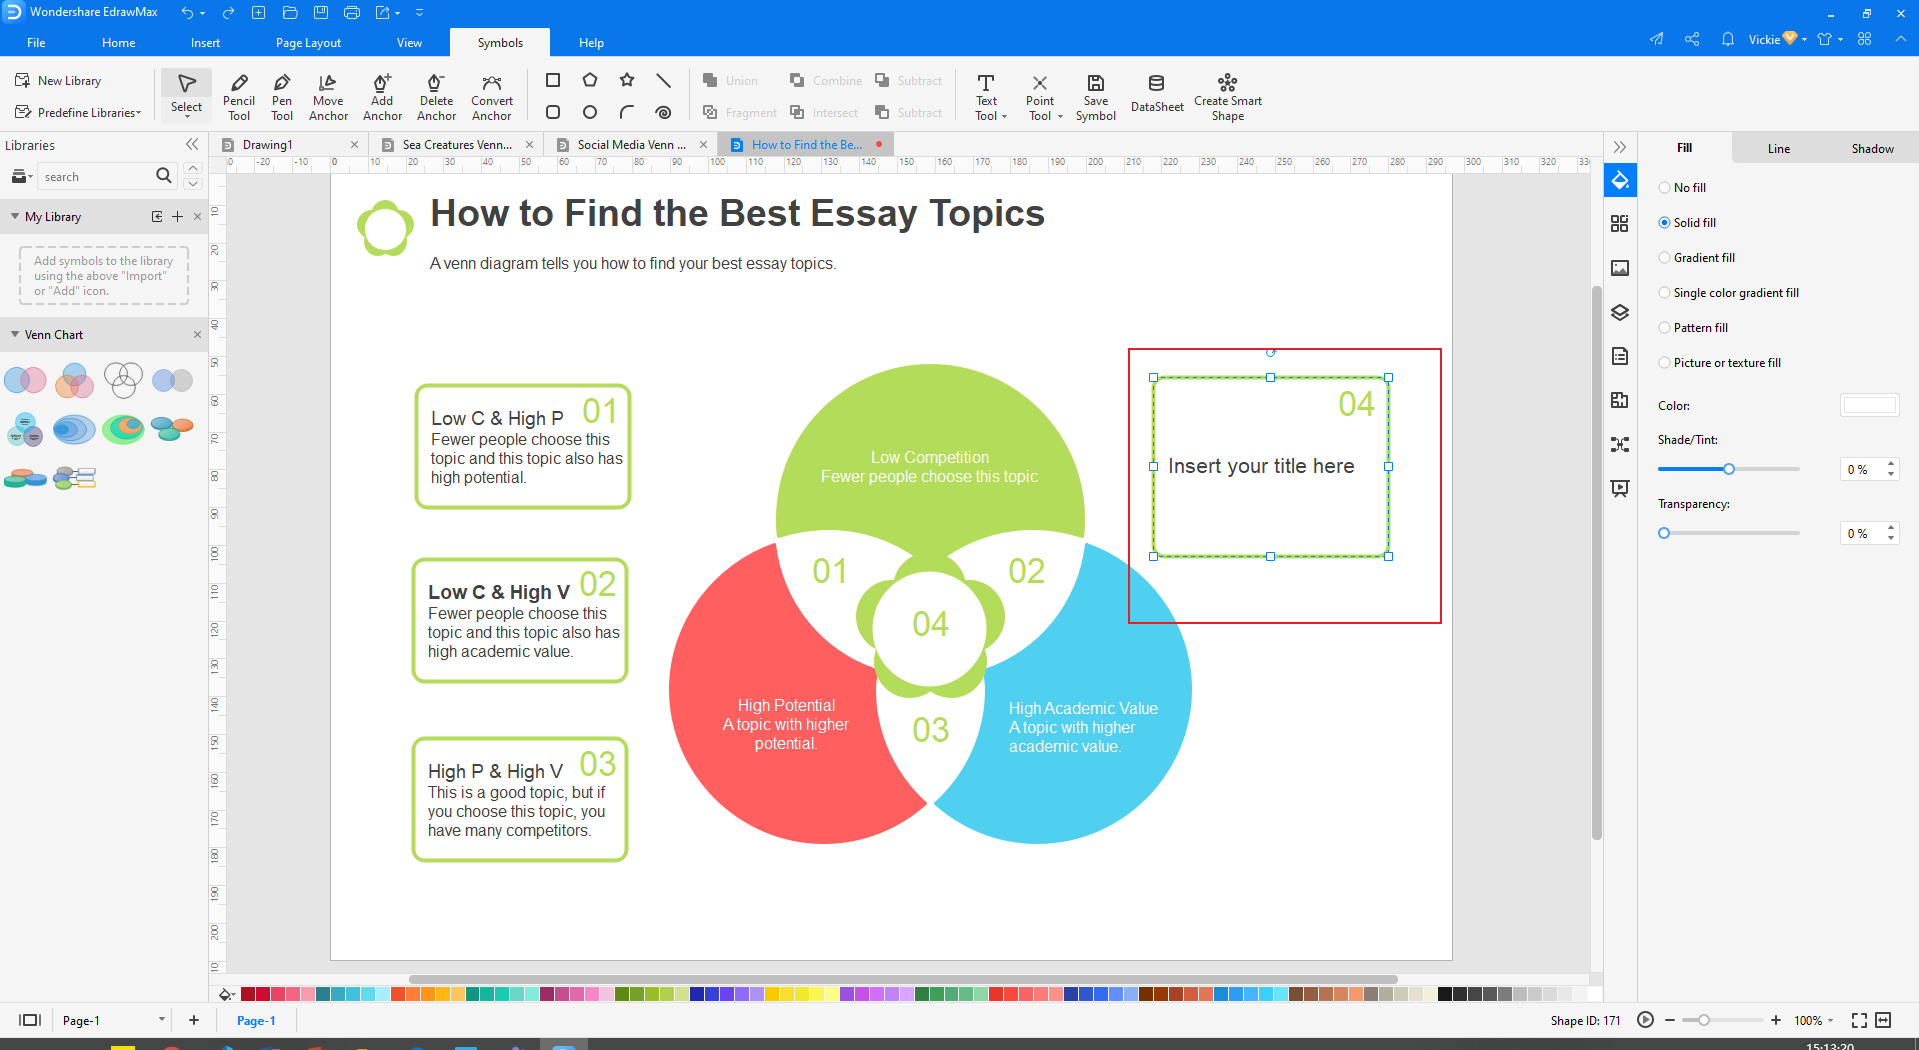
Step 3: Edit Venn Diagram and Text
Keep in mind that all elements in a Venn diagram can be edited, modified, or treated independently. This means you can remove one symbol and replace it with another, edit text only, etc. so here is how you edit your diagram:
• Right-click the diagram and click [Ungroup] from the pop text menu. (If they are grouped already, but if not, you don’t need to do this step)
• After ungrouping, you can now modify any element independently, like changing shape, position, or even adjusting its size.
• To edit text, double click on the text field [Example Text/ Insert Your Title], then type your preferred information there. Repeat this procedure to edit any other text you will like too.
• To change the color of the symbols, tap on that symbol, for example, a circle, and then choose your preferred color from the color tap below it.
• Selecting your them style: If you ill like to have your own them and style incorporated to make it unique and professional, click and choose from the available color and fonts.
• Once you’re done with medication, click Ctrl + A to select all symbols, then right-click on any part of the diagram and select [Group] from the pop-up menu. NOT necessary.
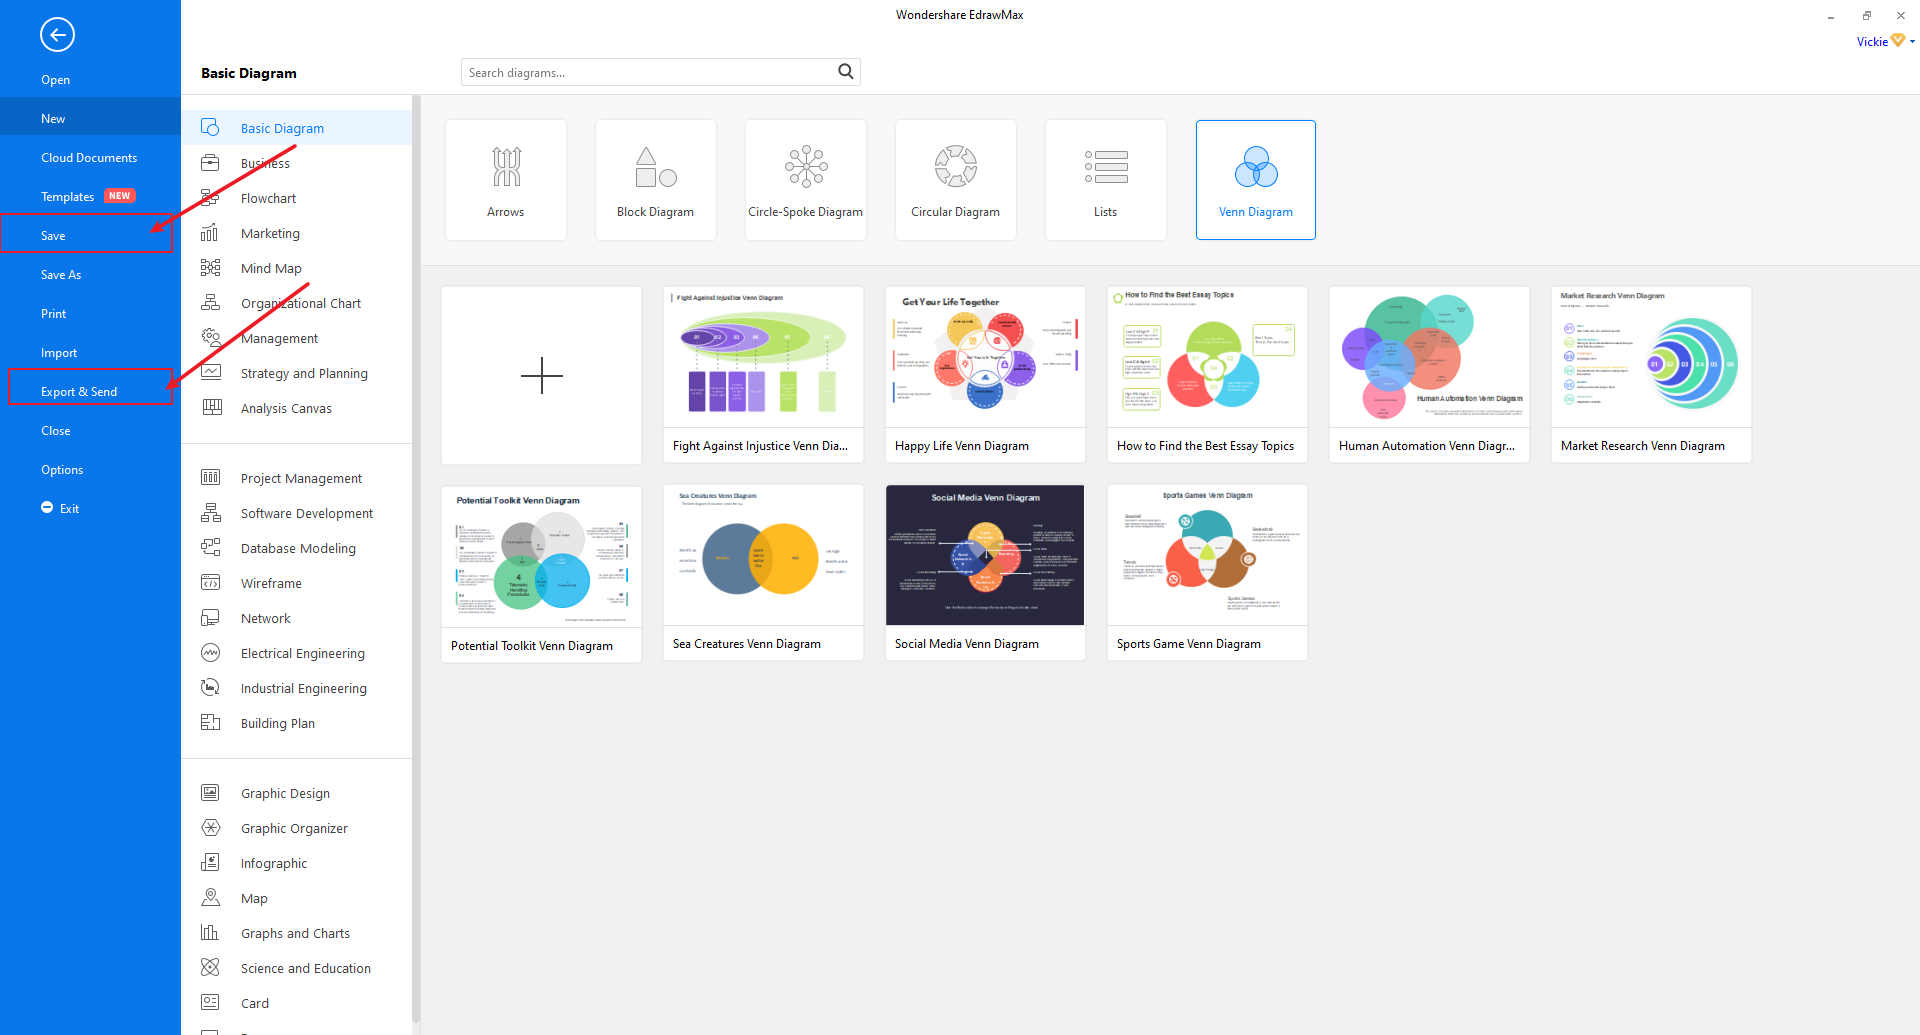
Step 4: Save, Export, and Share
After you’re done with all modifications, you can now save, Export, and share your Complete Venn diagram.
• To save it, click on the [File] at the top left corner and then select [Save or Save As] on the drop-down menu.
• To Export, it follows the same procedure but selects [Export] on the drop-down menu.
• To share it, click on the share icon at the top right side of your screen.
Beyond the Basics: Venn Diagram Examples & Use Cases
EdrawMax’s templates cater to a wide array of applications:
-
Project Management: Visualize task ownership, overlapping responsibilities, or cross-functional collaboration across teams.
-
Problem-Solving: Identify common factors among multiple issues to uncover root causes and streamline solutions.
-
Personal Decision-Making: Weigh pros and cons between different options, highlighting shared benefits and unique drawbacks.
Stop Wasting Time—Create Your Venn Diagram Now!
Why spend time manually aligning shapes when you can achieve a better result in a fraction of the time? EdrawMax is designed to make visual communication quick, easy, and effective.
Click to try EdrawMax for free and discover how you can create professional Venn diagrams and many other visuals in minutes. Empower your ideas and communicate with clarity today.
FAQ
-
1. Is a Venn diagram always 3 circles?
Venn diagrams can consist of multiple intersections and circle sets, but the most often used is the 3-circle or triple Venn diagram. -
2. What can I use instead of a Venn diagram?
Venn diagram alternatives include Euler diagrams, which show disjoint sets, UpSet plots for complex intersections, and tables or bar charts for simpler comparisons. Other options are matrix charts, T-charts, and mind maps, which serve as tools for comparing and contrasting information in a structured way. -
3. What is ∩ in a Venn diagram?
Intersection (∩): Represents all elements shared or common within the selected sets or groupings. Intersection represents shared elements (in the middle) within sets X and Y. Complement (XC): Represents whatever is not represented in a particular set; in this case, everything not in set X.
